Each year Medscape conducts a nationwide study of physician salaries and compensation. Medscape is surely one of the best online resources for researching physician salaries. (See my article here about all the different online resources, databases, and surveys regarding physician salaries) The data are a combination of over 20,000 surveys completed by physicians of every specialty all over the country. The results for 2012 were published in late April. To compare the results of the Medscape Physician Compensation Report to the other well-known online survey results, check out my ‘Ultimate Guide to Physician Salaries‘ where you can compare all the available resources.
Results: Physician Salary by Specialty
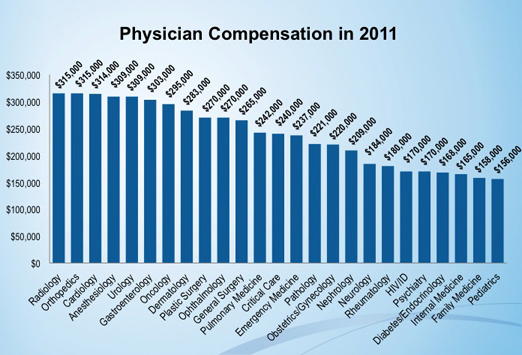
Radiology and orthopedics are again the big money winners, bringing home an average salary of $315,000. Family medicine and pediatrics earn the smallest salaries of all physicians at less than $160,000 a piece.
To see the full results, go to http://www.medscape.com/sites/public/physician-comp/2012. You will need to obtain a FREE username and password, but the information is well worth the 10 seconds that will take.
Results: Physician Salary by Location
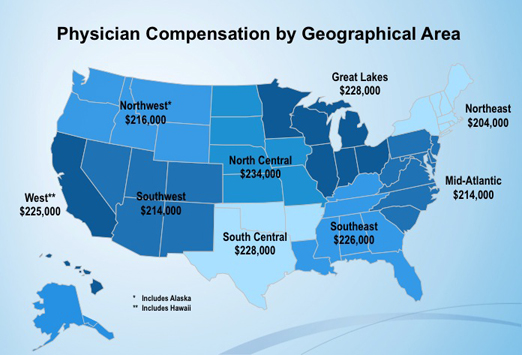
The Medscape survey also sheds light on some very interesting questions like ‘where in the US do physicians earn the most money?’ As you can see by the medscape graphic below, the average physician salary is nearly equal in all parts of the country. This is not the case in each specialty, but overall, there is no large difference.
Results: Changes in Salary since 2010
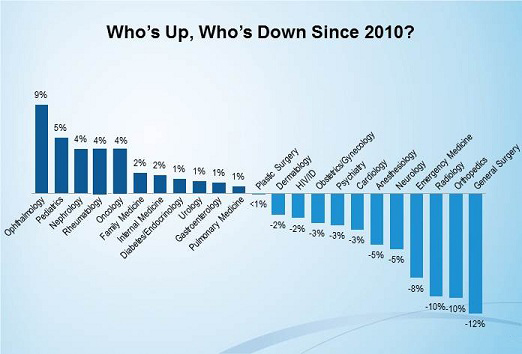
Medscape compares the average salary by specialty in 2012 to the same averages seen in 2010. The resulting data shed some light on the changes in physician salaries over the past couple years. As you can see in the graphic below, ophthalmologists have enjoyed the largest increase in salary over the past two years while radiologists, orthopedists, and general surgeons have suffered the largest decline in wage. The increase in ophthalmology compensation is interesting as they were the specialty that suffered the largest decline in salary between 2000 and 2010. What we learn from this graph is simple: those that earn the most are the the greatest risk of declining salaries. This is because those who decide how much we all get reimbursed (i.e. Medicare and Medicaid bosses) will always go after those that are earning the most money. This is exactly what is happening right now to radiology and orthopedics, and is exactly what happened to ophthalmology 10 years ago.
Results: Hours, Lifestyle, Satisfaction
In addition to salary information, the Medscape compensation report also details the number of hours worked in a week, the number of patients seen in a week, how satisfied doctors are with their specialty of choice, and many other questions. Each of these questions is divided up by specialties so we can compare the results between specialties.
Again, here is the link to the main Medscape Physician Compensation Report
http://www.medscape.com/sites/public/physician-comp/2012
Also, medscape provides a detailed report for each specialty including the above data: salary, hours, lifestyle, satisfaction, etc. Click on the specialty below to be taken to the individual report. [LOGIN REQUIRED]


 My name is Andrew and I am a first year resident training to be an ophthalmologist. I created ShortWhiteCoats to provide medical students, residents, and the public with all the information I spent so many hours looking for during medical school.


