Tag Archive: salary

FREIDA: Also a Great Resource to Compare Specialties

FREIDA Online is a fantastic resource for any medical student. I recently wrote about how students can compare individual residency programs using FREIDA's various different variables.  The database is not limited to comparing individual training programs; it also allows students to compare different specialties.  

The "Specialty Training Statistics" section provides basic statistics about training in each specialty. Variables presented for each specialty include:

  1. Number of residency programs in the US
  2. Length of training programs
  3. Average number of interviews performed by each residency program
  4. Total number of residents
  5. Gender Gap for each specialty
  6. Average number of faculty per resident
  7. Average number of work hours per week for each specialty
  8. Average number of days off per week  (THESE LAST TWO ARE VERY IMPORTANT!  COMPARE SPECIALTIES!)

LINK HERE


The "Graduate Career Plans" section of FREIDA provides information about the careers plans of each of the medical specialties.  Variables presented for each specialty include:

  1. Percentage of residency graduates pursuing further training
  2. Percentage of last year's graduates who are in private practice
  3. Percentage of last year's graduates who are employed in academic settings
  4. Percentage in the military
  5. Percentage employed as basic scientists
  6. Percentage who are unemployed

In each case, the statistics are taken from the most recent graduating class and the database is updated each year. 

LINK HERE


Read these data carefully.  I found that the "Hours Per Week" section was very useful and very realistic!

Allied Health Salaries

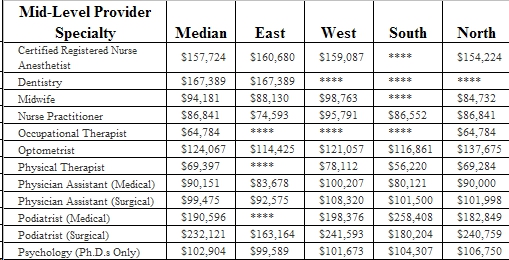
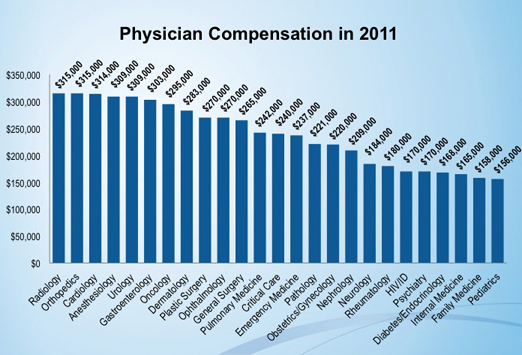
The new Medscape Physician Compensation Report identified internal medicine, family medicine, and pediatrics as the lowest earners in medicine (each with an average of less than $165,000 per year).  I wanted to compare these results to the updated information from the Cejka Search group who publish data on the salaries of allied health professionals. The Cejka Database is the best place I have found for reliable information about the salaries of allied health practitioners. The list of allied health workers is long and includes:

  • Nurse Practitioners (NP)
  • Certified Nurse Aneasthatists (CRNA)
  • Physicians Assistant (PA)
  • Podiatrist (DPM)
  • Occupational Therapist (OT)
  • Physical Therapist (PT)
  • Optomotrist (OD)
  • Psychologist (PhD)
  • Dentist (DMD or DDS)
  • Midwife

Cejka reports the following salary information for these allied health professionals.  As you can see, CRNAs and Dentists earn more money than our country’s primary care physicians (pediatricians, family physicians, general internists).  This is just the yearly salary information, not taking into account the number of hours worked. Very few allied health professionals work the average hours per week worked by primary care physicians in the US (60 hours is a very conservative estimate for our PCPs). This means the dollars per hour is vastly different between some allied health practitioners and our primary care doctors. How do you feel about this?

From Cejka Search

The Most Recruited Medical Specialties

Now that I am in the first year of residency I am beginning to think about landing that first real job.  As a Transitional Year resident I am heavily involved with the Internal Medicine residents at my hospital.  I found out very quickly that these internal medicine residents are HIGHLY sought after. In fact, many of them receive job offers on a weekly, or even daily basis.  The jobs that are in highest demand for internists are outpatient primary care and inpatient hospitality.  Many of my senior residents are being offered salaries between $200,000 and $300,000 along with many benefits including loan repayment. There are even some offers higher than $300,000 for less desirable locations! This is in a stark contrast to the ophthalmology job market that I will face, where starting salaries are low and it is terribly difficult to get your foot in the door.

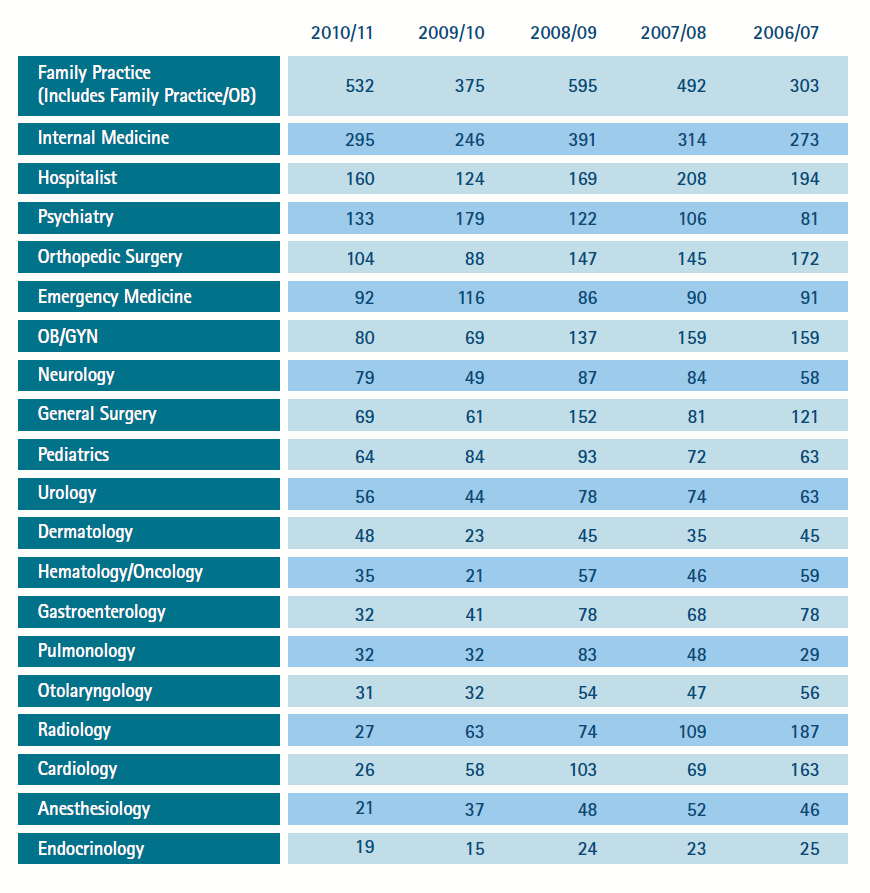
Recently, I came across the Merritt Hawkins database.  Merritt Hawkins obtains information about starting salaries and benefits for newly graduated residents. I speak about their great physician salary database in my Ultimate Guide to Physician Salaries. However, their database also contains a list of the 20 most recruited specialties in medicine. The list may shock you!  The ability to find a well paying job right out of residency is NOT AT ALL correlated with the competitiveness of the specialty.  Case in point: family physicians and general internists are the two most highly recruited specialists in medicine!

From Merritt Hawkins


This list represents the Top 20 most ‘requested physician searches by medical specialty.’ The numbers represent the number of times Merritt Hawkins was used to recruit a person from the respective specialties (Merritt Hawkins full PDF including physician compensation data is available here for free). So, when you are deciding on a specialty, don’t forget that competitive does not equal good job placement.  In fact, many of the least competitive specialties are very high on this list (pediatrics, psychiatry, family medicine)

The Ultimate Guide to Physician Salaries

In light of the new Medscape Physician Compensation Report 2012 that was just released, I thought it was time to compile all the data on physician salaries into one place. There are many resources online that report average physician salaries, and many of them offer very different results. I recently wrote an article detailing the pros and the cons many of these online physician salary and compensation databases.  However, it can be a bit tedious to go through all the work of visiting each website to compare results.  So, I have done all the work for you. In this article I will present the physician salary by specialty data from all the reliable and relevant online physician salary databases.  Feel free to compare and contrast the information presented by each different company.

Medscape Physician Compensation Report

In my opinion, the Medscape average physician salary report is the most reliable data on the internet. It represents more than 20,000 physician surveys answered by doctors in every specialty in every part of the country. See my article about the 2012 Medscape report to learn about all the great information they report in their results.


Careers In Medicine: Specialty Pages

Careers in Medicine (CiM) is a great resource for medical students and medical residents (link to my previous article about Careers in medicine). One of the greatest tools it provides is a list of salary information for each specialty.  Careers in Medicine separates the compensation information using two very important distinctions: academic vs. private practice and starting salaries vs. established salaries.  CiM obtains the academic salary information from the Association of American Medical Colleges AAMC Report on Medical School Faculty Salaries. The data about private practice salaries comes from the MGMA Physician Compensation Survey.  Below, I have compiled a table of the salaries reported for each specialty. (Click here to download the formatted table) On the CiM website you can also see salary data for every sub-specialty; this is especially important for internal medicine, pediatrics, and general surgery where the sub-specialty choice results in very different salaries.

Compiled from the Careers in Medicine website, AAMC


Allied Physicians: Old Salary Survey

Many students use the alliedphysicians.com resource to learn about physician salaries by specialty. However, you should know that it has not been updated since 2006, so the information is likely a bit off now but the trends are still the same.

From alliedphysicians.com


Cejka Search

The Cejka Search Group is a great resource for salary information but also for job openings and employment information. Their physician salary survey is up-to-date and updated frequently. They freely publish their salary information in order to advertise the many physician job openings they have available.

Physician Specialty

Median Physician Compensation Data

Allergy & Immunology

$249,674

Anesthesiology

$370,500

Cardiac & Thoracic Surgery

$533,084

Cardiology

$402,000

Colon & Rectal Surgery

$394,723

Critical Care Medicine

$264,750

Dermatology

$375,176

Diagnostic Radiology – Interventional

$478,000

Diagnostic Radiology – Non-Interventional

$454,205

Emergency Care

$267,293

Endocrinology

$218,855

Family Medicine

$208,861

Family Medicine – with Obstetrics

$209,565

Gastroenterology

$405,000

General Surgery

$357,091

Geriatrics

$187,602

Gynecological Oncology

$413,500

Gynecology

$232,075

Gynecology & Obstetrics

$275,152

Hematology & Medical Oncology

$320,907

Hospitalist

$215,716

Hypertension & Nephrology

$259,677

Infectious Disease

$227,750

Intensivist

$313,152

Internal Medicine

$214,307

Neonatology

$280,771

Neurological Surgery

$592,811

Neurology

$236,500

Nuclear Medicine (M.D. only)

$331,000

Obstetrics

$275,152

Occupational / Environmental Medicine

$223,750

Ophthalmology

$238,200

Oral Surgery

$380,500

Orthopedic Surgery

$500,672

Orthopedic Surgery – Hand

$476,039

Orthopedic Surgery – Joint Replacement

$605,953

Orthopedic Surgery – Pediatrics

$425,000

Orthopedic Surgery – Spine

$688,503

Orthopedic-Medical

$297,348

Otolaryngology

$368,777

Pathology (M.D. only)

$354,750

Pediatric Allergy

$198,458

Pediatric Cardiology

$233,958

Pediatric Endocrinology

$187,957

Pediatric Gastroenterology

$240,895

Pediatric Hematology / Oncology

$212,577

Pediatric Infectious Disease

$209,680

Pediatric Intensive Care

$272,000

Pediatric Nephrology

$198,686

Pediatric Neurology

$219,561

Pediatric Pulmonary Disease

$201,841

Pediatric Surgery

$419,783

Pediatrics & Adolescent

$209,873

Perinatology

$394,121

Physical Medicine & Rehabilitation

$237,628

Plastic & Reconstructive Surgery

$390,142

Psychiatry

$214,740

Psychiatry – Child

$216,360

Pulmonary Disease

$306,829

Radiation Therapy (M.D. only)

$447,250

Reproductive Endocrinology

$317,312

Rheumatologic Disease

$224,000

Sports Medicine

$231,540

Transplant Surgery – Kidney

$365,125

Transplant Surgery – Liver

$454,287

Trauma Surgery

$424,555

Urgent Care

$222,920

Urology

$413,941

Vascular Surgery

$413,629

Profiles Database Physician Salary Data

Profilesdatabase.com is another online physician recruitment company. They also publish their physician salary data freely in order to publicize their many job openings. Like the Cejka Search, these numbers are updated frequently and seem to be very reliable.

Specialty

National Average, Six Years in Practice

Median Starting Range

Allergy & Immunology

$246,000.00

$190,000.00

Anesthesiology

$360,000.00

$265,000.00

Cardiac & Thoracic Surgery

$522,875.00

$360,000.00

Cardiology

$402,000.00

$272,000.00

Colon& Rectal Surgery

$389,700.00

$290,000.00

Critical Care Medicine

$258,750.00

$198,000.00

Dermatology

$365,450.00

$234,000.00

Diagnostic Radiology – Interventional

$469,800.00

$335,000.00

Diagnostic Radiology – Non-Interventional

$444,850.00

$330,000.00

Endocrinology

$214,550.00

$165,000.00

Family Medicine

$199,850.00

$138,000.00

Family Medicine – with Obstetrics

$207,900.00

$142,000.00

Gastroenterology

$398,800.00

$272,000.00

General Surgery

$350,000.00

$225,000.00

Gynecological Oncology

$402,000.00

$300,000.00

Gynecology

$233,000.00

$210,000.00

Gynecology & Obstetrics

$279,750.00

$200,000.00

Hematology & Medical Oncology

$314,800.00

$222,000.00

Hospitalist

$210,950.00

$165,000.00

Nephrology

$252,000.00

$180,000.00

Infectious Disease

$225,000.00

$158,000.00

Internal Medicine

$208,790.00

$145,000.00

Neonatology

$275,400.00

$196,000.00

Neurological Surgery

$589,500.00

$395,000.00

Neurology

$237,000.00

$190,000.00

Ophthalmology

$248,000.00

$210,000.00

Orthopedic Surgery

$485,500.00

$315,000.00

Orthopedic Surgery – Pediatrics

$395,420.00

$318,000.00

Orthopedic Surgery – Spine

$625,000.00

$465,000.00

Otolaryngology

$350,000.00

$222,000.00

Pediatric Cardiology

$230,900.00

$189,000.00

Pediatric Endocrinology

$187,600.00

$170,000.00

Pediatric Gastroenterology

$230,500.00

$175,000.00

Pediatric Hematology / Oncology

$210,000.00

$175,000.00

Pediatric Infectious Disease

$205,00.00

$173,000.00

Pediatric Intensive Care

$252,500.00

$195,000.00

Pediatric Nephrology

$196,000.00

$172,000.00

Pediatric Neurology

$218,200.00

$182,000.00

Pediatric Pulmonary Disease

$190,000.00

$162,000.00

Pediatric Surgery

$401,000.00

$295,000.00

Pediatrics

$202,500.00

$162,000.00

Physical Medicine & Rehabilitation

$233,300.00

$178,000.00

Plastic  Surgery

$382,000.00

$273,000.00

Psychiatry

$211,000.00

$165,000.00

Psychiatry – Child

$218,300.00

$159,000.00

Pulmonary Disease

$298,000.00

$191,500.00

Rheumatology

$220,500.00

$163,500.00

Trauma Surgery

$400,000.00

$298,000.00

Urgent Care

$215,000.00

$142,000.00

Urology

$400,000.00

$250,000.00

Vascular Surgery

$405,000.00

$259,400.00

Merritt Hawkins: Physician Salary By Specialty

Merritt Hawkins is a physician salary survey that reports the average starting salary offered to new residency graduates.  The entire report for the year 2011 is available for free in PDF (click here). Remember, because these data represent new hires, the are STARTING SALARIES and should be compared to other reports accordingly. I will reprint the starting salaries of the 20 most highly recruited specialties below. The Merritt Hawkins PDF also reports the average signing bonus and average income guarantees. (If you are interested, I discuss the Merritt Hawkins report on the salaries of allied health professionals in another post)


From Merritt Hawkins Free PDF


The Medscape Physician Compensation Report, 2012

Each year Medscape conducts a nationwide study of physician salaries and compensation.  Medscape is surely one of the best online resources for researching physician salaries.  (See my article here about all the different online resources, databases, and surveys regarding physician salaries)  The data are a combination of over 20,000 surveys completed by physicians of every specialty all over the country.  The results for 2012 were published in late April. To compare the results of the Medscape Physician Compensation Report to the other well-known online survey results, check out my ‘Ultimate Guide to Physician Salaries‘ where you can compare all the available resources.

Results: Physician Salary by Specialty

Radiology and orthopedics are again the big money winners, bringing home an average salary of $315,000.  Family medicine and pediatrics earn the smallest salaries of all physicians at less than $160,000 a piece.

Taken from medscape.com


To see the full results, go to http://www.medscape.com/sites/public/physician-comp/2012.  You will need to obtain a FREE username and password, but the information is well worth the 10 seconds that will take.


Results: Physician Salary by Location

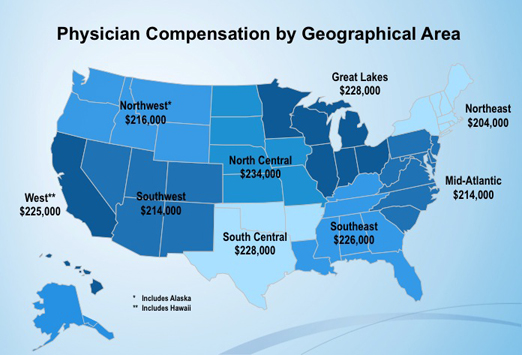
The Medscape survey also sheds light on some very interesting questions like ‘where in the US do physicians earn the most money?’  As you can see by the medscape graphic below, the average physician salary is nearly equal in all parts of the country. This is not the case in each specialty, but overall, there is no large difference.

Taken from medscape.com


Results: Changes in Salary since 2010

Medscape compares the average salary by specialty in 2012 to the same averages seen in 2010. The resulting data shed some light on the changes in physician salaries over the past couple years.  As you can see in the graphic below, ophthalmologists have enjoyed the largest increase in salary over the past two years while radiologists, orthopedists, and general surgeons have suffered the largest decline in wage.   The increase in ophthalmology compensation is interesting as they were the specialty that suffered the largest decline in salary between 2000 and 2010.  What we learn from this graph is simple: those that earn the most are the the greatest risk of declining salaries. This is because those who decide how much we all get reimbursed (i.e. Medicare and Medicaid bosses) will always go after those that are earning the most money. This is exactly what is happening right now to radiology and orthopedics, and is exactly what happened to ophthalmology 10 years ago.

From medscape.com

Results: Hours, Lifestyle, Satisfaction

In addition to salary information, the Medscape compensation report also details the number of hours worked in a week, the number of patients seen in a week, how satisfied doctors are with their specialty of choice, and many other questions.  Each of these questions is divided up by specialties so we can compare the results between specialties.

Again, here is the link to the main Medscape Physician Compensation Report
http://www.medscape.com/sites/public/physician-comp/2012

Also, medscape provides a detailed report for each specialty including the above data: salary, hours, lifestyle, satisfaction, etc. Click on the specialty below to be taken to the individual report. [LOGIN REQUIRED]


Resident and Fellow Salaries and Benefits

2011 Average Resident and Fellow Stipends

Every year the Association of American Medical Colleges (AAMC) compiles a survey of intern, resident, and fellow salaries across the country.  While most medical and surgical residents are paid similar stipends, there are certainly differences.  This will become a somewhat important factor in ranking residency programs during the fourth year of medical school.  The recent AAMC resident and fellow stipend report can be found here as a pdf document. The complete document describes current resident salaries and displays a chart of the average resident salaries all the way back to the 1960s.  Additionally, it details the difference in stipends between the northeast, the south, the west, and the midwest. Finally, it explains in detail what is included in the average benefits packages (i.e. medical insurance premiums, retirment plans, life insurance, disability ect).

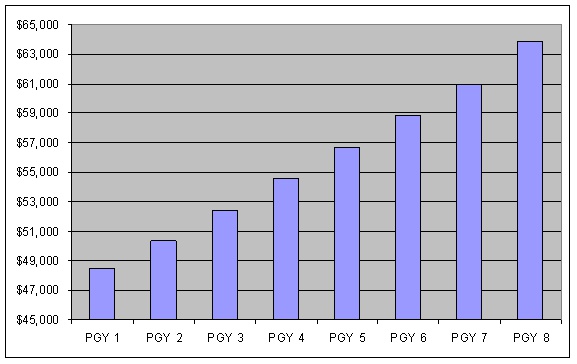
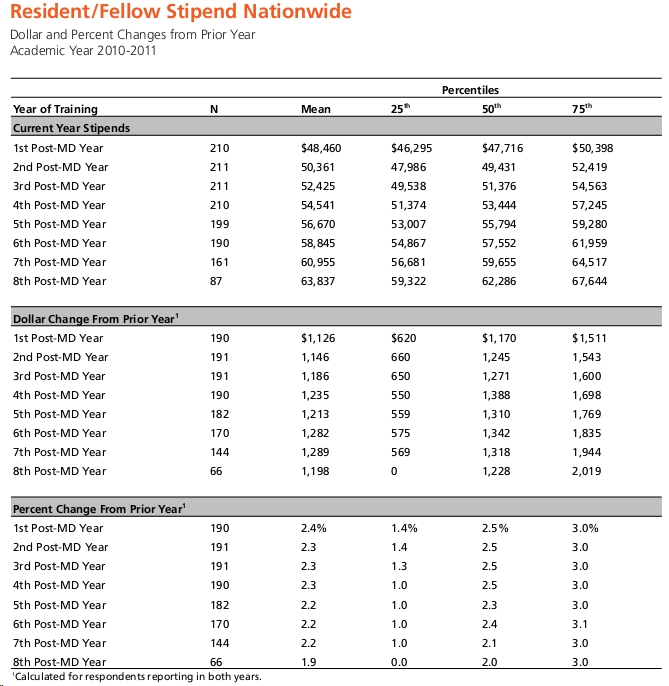
The report contains salary information for all training levels, intern thru post graduate year (PGY) eight. The national mean salary of each PGY level and the percent change from 2010 is shown below.  (taken from the AAMC document)

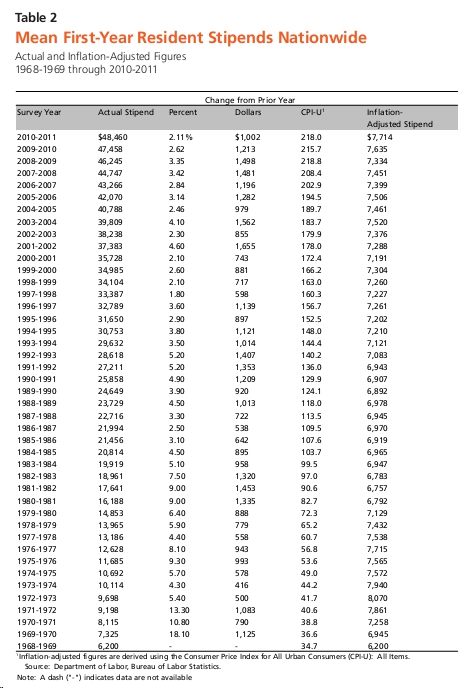
The next table displays the average first year resident (i.e. ‘intern’) salary each year since 1968.  The average increase in salary in recent years has been 2-4%.

As you will see in the complete document, the residency programs that pay the most are church sponsored hospitals in the northeast.  Those that pay the least are state hospitals in the south.

Average Physician Salary

In this article I will highlight some of the best online resources for researching physician salaries by specialty. I will explain why each site is good and why each site is less than idea. I do not print out any of the salary information. I recently wrote another article where all the salary information from these sites is printed. “The Ultimate Guide to Physician Salaries” is a complete analysis of all physician salary data online. You no longer have to google ‘physician salary’ to find all the best information, the Ultimate Guide to Physician Salary has it all laid out in one place.

The longer you are a medical student, the more you will think about this question. In most academic medicine circles, it is taboo to discuss salaries and earnings.  However, this is an important question and one that SHOULD NOT make you feel guilty.  The information is important in planning your life, budgeting your money and loan dollars, and in choosing a specialty.


There are a number of ways to research physician salaries, none of which is perfect.  When conducting this research you must remember that most private physicians own their own practice, are not employed, and therefore do not have an easy reportable income.  In this article we will review the best online resources to research physician salaries, and the pros and cons of each resource.  You should remember that most of these numbers come from email or snail mail surveys with small response rates, so the numbers will vary.  If the data you find online do not come from large physician surveys, they are probably not reliable.  Below I outline four very reliable sources.


#1  Medscape Physician Compensation Report

Each year Medscape conducts an enormous survey of physicians of every specialty (see my dedicated article about the newest report).  To access the results of the survey you must be a member of Medscape/Web MD.  This is a free service that I would suggest to all medical students even if you do not access their survey results (membership also provides free access to the best ipod/ipad/iphone apps for medical school which I discuss here).

Access to the site allows you to view the data for all specialties of medicine.  Medscape publishes one conglomerate presentation where they compare compensation among all specialties, all practice settings (private vs. multi specialty group vs. academic), and all locations (urban vs. rural).  In addition, they publish a presentation for each sub-specialty where they explore gender effects, time spent with patients, patient visits in a week, geographical sector (east coast vs. west coast vs. south vs. mid-west), and other factors affecting compensation.

http://www.medscape.com/features/slideshow/compensation/2011/
(login needed)

PROS:
Represents responses from over 15,000 physicians, the largest report of its kind.
Neat display and graphics
Tons of extra information about location, practice setting, etc
Updated yearly
They report the changes to compensation from year to year
Access to their site provides many other benefits (apps)

CONS:
You must have a login, which is free and non-intrusive


#2 Careers in Medicine website 

As I discussed in a previous article, the Careers in Medicine (CiM) website is a fantastic resource for all medical students.  The site provides tools to understand personality traits, which specialties you might enjoy the most, and ample information about each specialty in medicine.  One of the best parts about the website is the unbiased salary information they provide about each specialty and some sub-specialties.

Once you are logged on (medical school email address required) you will have to find the links to specialty pages, and then find the compensation tab.  These information reported is survey information and is updated periodically.  They offer the unique ability to compare academic salaries to those of private practitioners in each specialty and sub-specialty.  In addition, they report the salary information broken up into “First three years of career” and “Late career” to compare how compensation might change as your practice gets settled.

https://www.aamc.org/students/medstudents/cim/

PROS:
Unbiased information available only to medical students
Compare compensation of academic to private practice physicians
Part of a great web resource for all medical students
Includes ample information about each specialty

CONS:
You must have a login, which is free for all medical students
There is not compensation information about smaller sub-specialties


 #3 Merritt Hawkins

Merritt Hawkins is another web-based survey company that conducts an annual physician compensation survey.  Their data, however, is a little different than the other companies.  The report the results of salary and incentives offered to physicians through head-huThe results of their survey are open to the public.  They conduct a number of great analyses including identifying the most recruited specialties, where to find probono medical work, and their salary information.

Their main site provides links to all the above information

http://merritthawkins.com/

Their most recent salary information (2010) is available at the link below.

http://www.merritthawkins.com/uploadedFiles/MerrittHawkings/Surveys/mha2010incentivesurvPDF.pdf

PROS:
PDF format with ample information
Compare the results of the last 4 years’ surveys in the same pdf
Very large survey providing reliable results

CONS:
Not all specialties (ophthalmology) are included
No ditinction between practice situation and location


 #4 CEJKA Search

This is a little known resource that provides great information.  The AMGA Medical Group Compensation and Financial Survey is a  company that has been following physician salaries for 30 years.  They report the results of their analysis for free on their website.  There is no nonsense to their data, they simply list the median salary for all specialties in medicine.  They also provide compensation information for physician executives and for mid-level providers (PA, CNP, CRNA, Podiatrist, Optometrist, etc.)


http://www.cejkasearch.com/view-compensation-data/

PROS:
Clean format, easy to access
Easy to compare, all information on one webpage

CONS:
Fewer respondants than other surveys
Private company

#5 Allied Physicians Survey

The Allied Physicians survey is one of the most readily available tools to research physician salary information.  The organization has been collecting salary information since 2003.  It is unclear if they are still updating the information on their website as it posts “2006” as the most recent update.  The great part about this survey, however, is the ability to quickly compare all the specialties of medicine. They are reported in one webpage, side by side, so you do not have to click one hundred times to see all the information

http://www.alliedphysicians.com/salary-surveys/physicians/

PROS:
Clean format, easy to access
Easy to compare specialties
Demonstrates three compensation tiers (starting, 1-3 years, >3 years)

CONS:
Unclear if the survey is still being updated


#6 Public Record Information

As I mentioned in a previous post, many states have now made public university salary information open to the public.  This means that the salaries of many physicians who work at public academic medical centers are now widely accessible.  You can simply google “salary information” and the university you are interested in researching to find the data.  Or, you can go to the website below which has compiled all the information for you.

http://www.collegiatetimes.com/databases/salaries

PROS:
-Learn about real salary information of academic physicians
-Salary data for chairmen, deans, CEOs are all public record

CONS:
-Not all states represented
-Many universities have incentive structures built into salary information, so the numbers you see reported may not be the actual salary brought home by the physician.

Freedom of Information Acts and Physician Salaries

Many states have passed freedom of information acts that force public universities to publish the salary data for all of their employees. Whether you agree or disagree with this form of legislation, you should all know what information these acts provide you.  There are now a large number of academic medical centers whose salary information is available to you and the public.  A quick Google search will find the university you are interested and the department, specialty, or physician you would like to learn about.

If you are interested in working in academics, estimating your future salary was next to impossible before this information was made public.  We all know that academic docs usually make less money than private docs, but the taboo issue is never discussed.  Many sites provide survey information on how much physicians make in different specialties, but these rarely distinguish between private and academic physicians.  Now, thanks to the Freedom of Information Acts, you can know.

Because this information is public record, you can just search for it on the web.  I have found that the Collegiate Times website is very well organized and lets you search by University, Department, or Name.

http://www.collegiatetimes.com/databases/salaries

One last caveat.  You will see some information that is surely inaccurate.  Many physicians’ income in an academic center comes from a number of different sources (multiple departments, multiple hospitals, bonuses for productivity etc).  So, if you see an orthopedic surgeon making $60,000 don’t get an aneurysm, there is something else going on.

The Medscape Physician Compensation Report 2011

(See my article about the new 2012 Medscape Compensation Report here)

If you have not seen it already, the newest physician compensation report was recently released by Medscape.  Each year Medscape surveys thousands of physicians and reports the results in graphical form.  In order to access the report, you have to be a medscape member.  Don’t let this stop you, by joining medscape you will also have access to some of the best software and portable medical apps for free (see my previous post regarding these apps).  It is a win-win situation.

The main report can be found here,
http://www.medscape.com/sites/public/physician-comp/2011

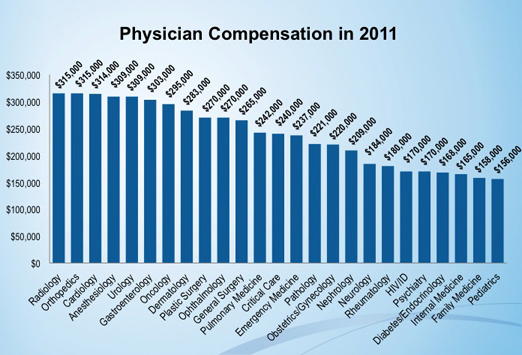
The report includes salary and compensation information on 23 specialties.  Medscape also publishes a specialty-specific report for each specialty which outlines geographical and practice specific factors that affect compensation.  The specialties are listed below with links to specialty specific reports (only available with Medscape account).