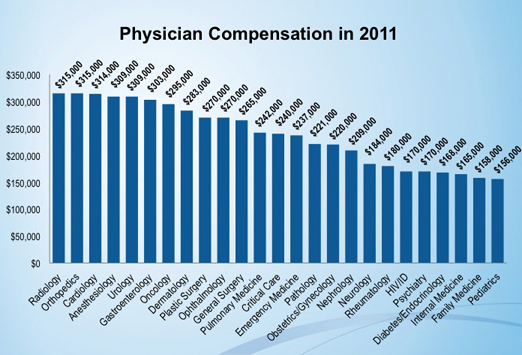
In light of the new Medscape Physician Compensation Report 2012 that was just released, I thought it was time to compile all the data on physician salaries into one place. There are many resources online that report average physician salaries, and many of them offer very different results. I recently wrote an article detailing the pros and the cons many of these online physician salary and compensation databases. However, it can be a bit tedious to go through all the work of visiting each website to compare results. So, I have done all the work for you. In this article I will present the physician salary by specialty data from all the reliable and relevant online physician salary databases. Feel free to compare and contrast the information presented by each different company.
Medscape Physician Compensation Report
In my opinion, the Medscape average physician salary report is the most reliable data on the internet. It represents more than 20,000 physician surveys answered by doctors in every specialty in every part of the country. See my article about the 2012 Medscape report to learn about all the great information they report in their results.
Careers In Medicine: Specialty Pages
Careers in Medicine (CiM) is a great resource for medical students and medical residents (link to my previous article about Careers in medicine). One of the greatest tools it provides is a list of salary information for each specialty. Careers in Medicine separates the compensation information using two very important distinctions: academic vs. private practice and starting salaries vs. established salaries. CiM obtains the academic salary information from the Association of American Medical Colleges AAMC Report on Medical School Faculty Salaries. The data about private practice salaries comes from the MGMA Physician Compensation Survey. Below, I have compiled a table of the salaries reported for each specialty. (Click here to download the formatted table) On the CiM website you can also see salary data for every sub-specialty; this is especially important for internal medicine, pediatrics, and general surgery where the sub-specialty choice results in very different salaries.
Allied Physicians: Old Salary Survey
Many students use the alliedphysicians.com resource to learn about physician salaries by specialty. However, you should know that it has not been updated since 2006, so the information is likely a bit off now but the trends are still the same.
Cejka Search
The Cejka Search Group is a great resource for salary information but also for job openings and employment information. Their physician salary survey is up-to-date and updated frequently. They freely publish their salary information in order to advertise the many physician job openings they have available.
Profiles Database Physician Salary Data
Profilesdatabase.com is another online physician recruitment company. They also publish their physician salary data freely in order to publicize their many job openings. Like the Cejka Search, these numbers are updated frequently and seem to be very reliable.
| Specialty |
National Average, Six Years in Practice |
Median Starting Range |
| Allergy & Immunology |
$246,000.00 |
$190,000.00 |
| Anesthesiology |
$360,000.00 |
$265,000.00 |
| Cardiac & Thoracic Surgery |
$522,875.00 |
$360,000.00 |
| Cardiology |
$402,000.00 |
$272,000.00 |
| Colon& Rectal Surgery |
$389,700.00 |
$290,000.00 |
| Critical Care Medicine |
$258,750.00 |
$198,000.00 |
| Dermatology |
$365,450.00 |
$234,000.00 |
| Diagnostic Radiology – Interventional |
$469,800.00 |
$335,000.00 |
| Diagnostic Radiology – Non-Interventional |
$444,850.00 |
$330,000.00 |
| Endocrinology |
$214,550.00 |
$165,000.00 |
| Family Medicine |
$199,850.00 |
$138,000.00 |
| Family Medicine – with Obstetrics |
$207,900.00 |
$142,000.00 |
| Gastroenterology |
$398,800.00 |
$272,000.00 |
| General Surgery |
$350,000.00 |
$225,000.00 |
| Gynecological Oncology |
$402,000.00 |
$300,000.00 |
| Gynecology |
$233,000.00 |
$210,000.00 |
| Gynecology & Obstetrics |
$279,750.00 |
$200,000.00 |
| Hematology & Medical Oncology |
$314,800.00 |
$222,000.00 |
| Hospitalist |
$210,950.00 |
$165,000.00 |
| Nephrology |
$252,000.00 |
$180,000.00 |
| Infectious Disease |
$225,000.00 |
$158,000.00 |
| Internal Medicine |
$208,790.00 |
$145,000.00 |
| Neonatology |
$275,400.00 |
$196,000.00 |
| Neurological Surgery |
$589,500.00 |
$395,000.00 |
| Neurology |
$237,000.00 |
$190,000.00 |
| Ophthalmology |
$248,000.00 |
$210,000.00 |
| Orthopedic Surgery |
$485,500.00 |
$315,000.00 |
| Orthopedic Surgery – Pediatrics |
$395,420.00 |
$318,000.00 |
| Orthopedic Surgery – Spine |
$625,000.00 |
$465,000.00 |
| Otolaryngology |
$350,000.00 |
$222,000.00 |
| Pediatric Cardiology |
$230,900.00 |
$189,000.00 |
| Pediatric Endocrinology |
$187,600.00 |
$170,000.00 |
| Pediatric Gastroenterology |
$230,500.00 |
$175,000.00 |
| Pediatric Hematology / Oncology |
$210,000.00 |
$175,000.00 |
| Pediatric Infectious Disease |
$205,00.00 |
$173,000.00 |
| Pediatric Intensive Care |
$252,500.00 |
$195,000.00 |
| Pediatric Nephrology |
$196,000.00 |
$172,000.00 |
| Pediatric Neurology |
$218,200.00 |
$182,000.00 |
| Pediatric Pulmonary Disease |
$190,000.00 |
$162,000.00 |
| Pediatric Surgery |
$401,000.00 |
$295,000.00 |
| Pediatrics |
$202,500.00 |
$162,000.00 |
| Physical Medicine & Rehabilitation |
$233,300.00 |
$178,000.00 |
| Plastic Surgery |
$382,000.00 |
$273,000.00 |
| Psychiatry |
$211,000.00 |
$165,000.00 |
| Psychiatry – Child |
$218,300.00 |
$159,000.00 |
| Pulmonary Disease |
$298,000.00 |
$191,500.00 |
| Rheumatology |
$220,500.00 |
$163,500.00 |
| Trauma Surgery |
$400,000.00 |
$298,000.00 |
| Urgent Care |
$215,000.00 |
$142,000.00 |
| Urology |
$400,000.00 |
$250,000.00 |
| Vascular Surgery |
$405,000.00 |
$259,400.00 |
Merritt Hawkins: Physician Salary By Specialty
Merritt Hawkins is a physician salary survey that reports the average starting salary offered to new residency graduates. The entire report for the year 2011 is available for free in PDF (click here). Remember, because these data represent new hires, the are STARTING SALARIES and should be compared to other reports accordingly. I will reprint the starting salaries of the 20 most highly recruited specialties below. The Merritt Hawkins PDF also reports the average signing bonus and average income guarantees. (If you are interested, I discuss the Merritt Hawkins report on the salaries of allied health professionals in another post)


 My name is Andrew and I am a first year resident training to be an ophthalmologist. I created ShortWhiteCoats to provide medical students, residents, and the public with all the information I spent so many hours looking for during medical school.


